

Linearity and Non-Linearity in Data
Linear separable data, Non-Linear separable data and Activation functions in Deep Learning models

C# developer | Deep Learning | Immersive Tech
Also a problem solving human, who always try to find solutions by building softwares. I am not a coder, but a creator. Coding is just my tool of choice to build or problem solving softwares.
Introduction
In a machine learning classification (or regression) problem, when we start observing our data as a novice, excited about what it would be like when we finally fit our model with training and validation data but in reality when we fit it, the results showed up with a 50% accuracy. Spending hours on adjusting our model hyperparameters or if we're building a deep learning model, adjusting its layers and neurons but still ending up with 50% accuracy.
Damn! Why our model is showing results as if it's just making a guess?
As a beginner, when we are not exposed enough to a wide variety of data and machine-learning problems we often underestimate the power of data visualisation.
Well in my case, it was common.
Data visualisation many times behaves like a man holding a lamp to show your way in an undiscovered wild forest, being philosophical. helps you take better decisions like choosing the appropriate algorithms for your problem, what kind of data preprocessing is needed, what evaluation metrics we should be focusing on and much more...
Quick question 🤔 : When you solved your first machine learning problem, what was the first thing you did after receiving your data?
I brew my ☕️
Data visualisation before preprocessing or doing anything with data also helps us to get familiar with the data, suppose doing a binary classification problem, we might want to visualize how two classes of data are separable.
If we can identify, that area, that region, which separates the two classes then it will be very easy to explain the machine as well and to create a high-performance model.
"I think this much build-up for this blog is enough" 😅
Technically, data separability can be classified into two ways, Linear separable data and Non-Linear separable data.
What is Linear separable data
Linearly separable data is the data in which two classes can be separated using a line when plotted on a scatter plot.
If we have a dataset of Items and Fruit identifier list in boolean,
import pandas as pd
linear_df = pd.DataFrame({"Items":['Apple', 'Orange', 'Potato', 'Cabbage'], "Fruit":[1, 1, 0, 0]})
Here, if we plot a scatter plot then it should display something like the below image where Items can be classified into two classes, whether fruit or not, separated with a line.

🔑 We can use make_blobs dataset from sklearn.datasets to demonstrate this problem more professionally.
What is Non-Linear separable data
On the other hand, non-linear separable data is data which can't be plotted easily on a 2-D scatter plot and can't create a clear visible classification between two classes with a single straight line.
Suppose, I import a dataset called make_circles() from sklearn.datasets,
from sklearn.datasets import make_circles

# Make 1000 samples
n_samples = 1000
# Create circles
X, y = make_circles(n_samples,
                    noise=0.03,
                    random_state=17)
and, if we plot them using the scatter plot it will show something like this,

If we ask our model to draw a straight line to differentiate the two classes it would be harder for it to decide which belongs to which class.
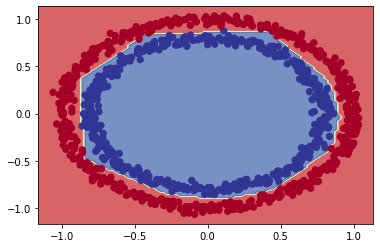
So when I build a binary classification model with non-linear data and plotted a decision boundary using the prediction of the model, it gave output something like this,

📖 You can use mlxtend to plot decision boundaries, or you can check out another resource here.
How to work with Non-Linear data
If you're a fan of neural networks then you're lucky, because Neural Networks are strongly capable of solving complex datasets with much ease compared to traditional statistical algorithms.
We already have seen in the above images, that our model (which is a neural network model) can draw straight lines which also means linear or linearity.
But since our data is non-linear then how to tell the neural network that we also need non-straight lines to handle non-linear data?
To achieve this, we need to understand some brief about Activation functions.
As the name says, activation, activation functions decide whether a neuron should be activated or not in a layer of a neural network. This means that it will decide whether the input of the neuron is important to the network or not. It bounds the value of the input to the network.
Types of Activation Functions
Activation functions can be classified into multiple categories based on the use case, but for use in deep-learning models, the most used functions can be categorized into linear and non-linear activation functions.
Programmatically, if we don't specify the network which activation function to use, by default it considers None activation functions.
But since we know, that if we have non-linearly separable data, we also need to specify the network that we're dealing with non-linearly separable data, so use non-linear activation functions.
Some of the most used non-linear activation functions are,
However there are other more, and as I mentioned above, it is based on the use case, but most of the deep learning models use ReLu (Rectified Linear Unit) due to its performance, it performs faster than other non-linear functions because it behaves like a linear function or close to linear.
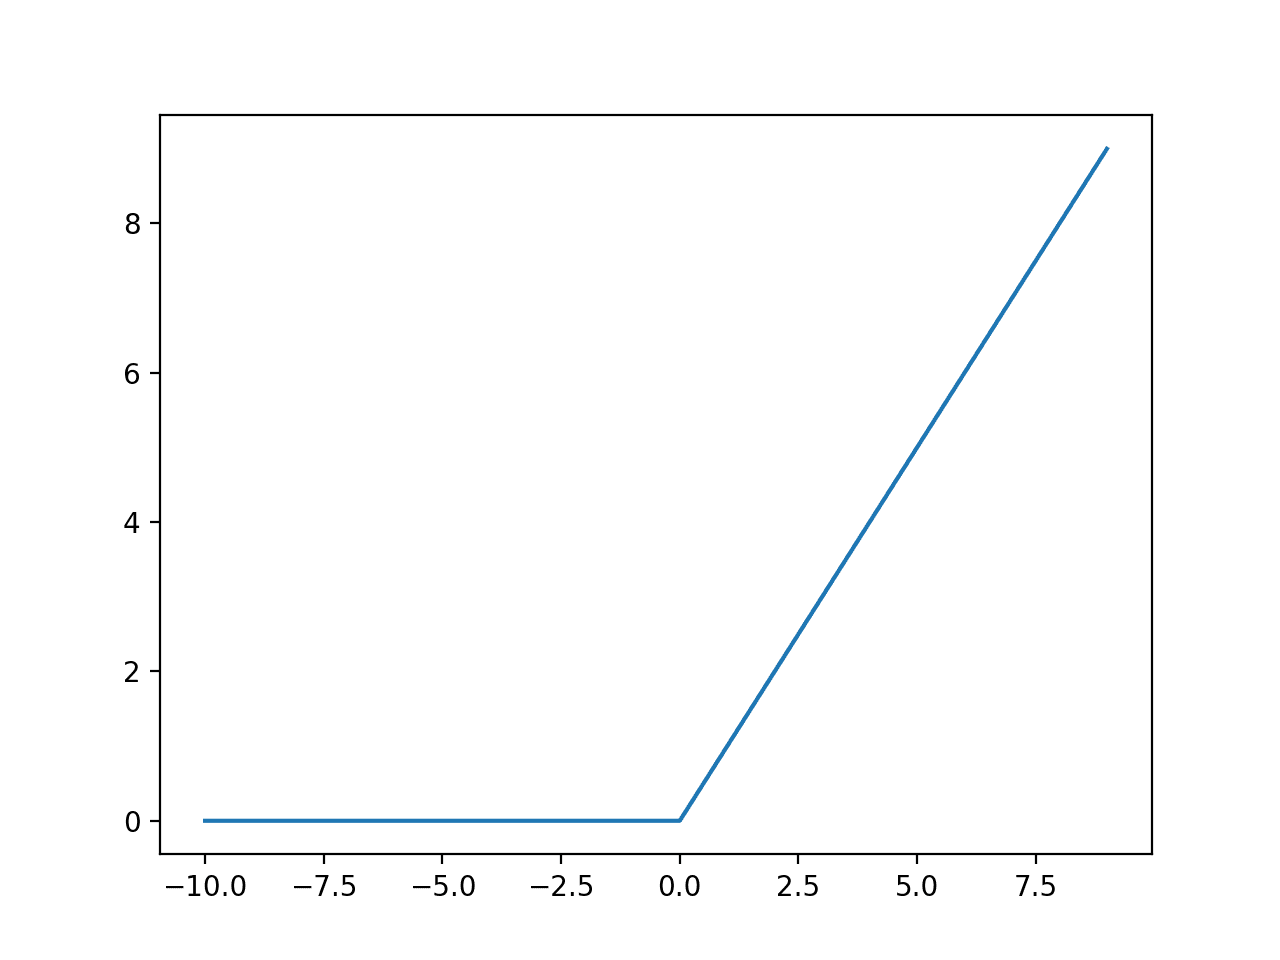
ReLu is defined as,
$$f(x) = max(0,x)$$
Pythonically, it can be achieved by,
if input > 0:
    input
else:
    0
And if we plot it,
So, let's see the difference when we were using the Linear Activation function for a dataset like a circle, using TensorFlow playground to showcase

Notice, in the output, it is not able to differentiate the two classes.
When I use ReLu as the activation function, using the same representation of the dataset and number of layers,
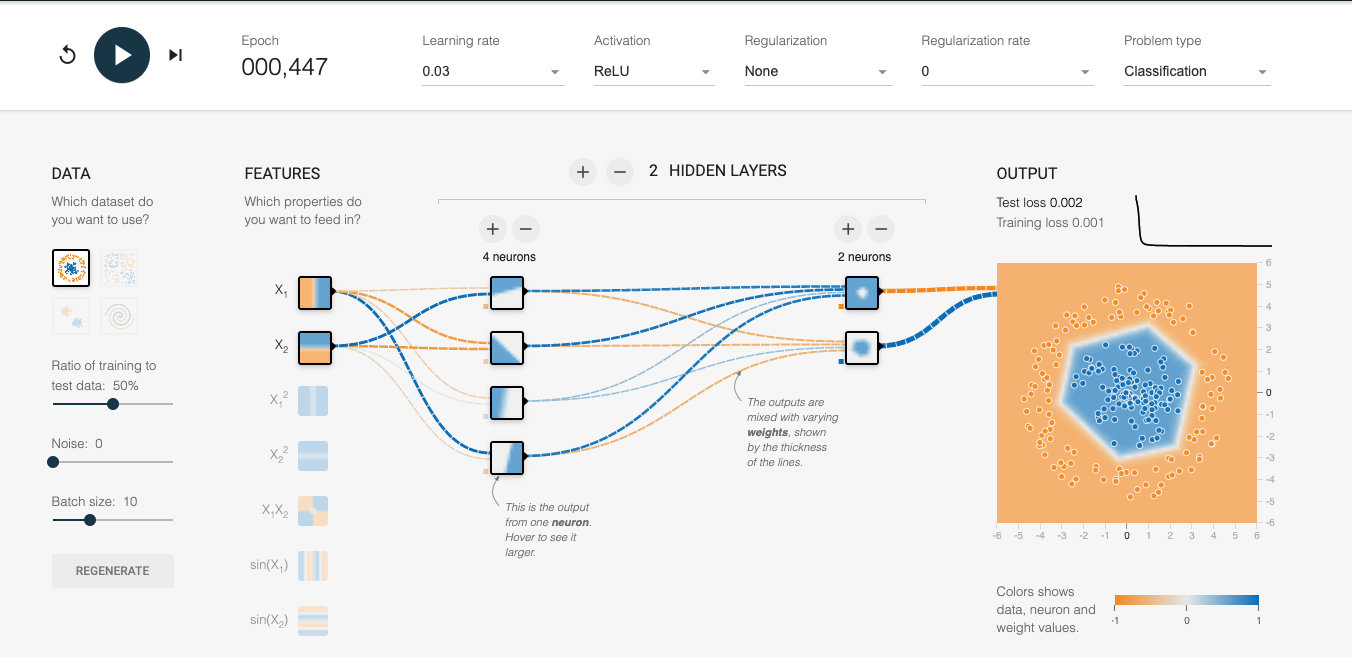
Excellent ! Notice how visibly clear it is now, the network can differentiate between the two classes in non-linear data. But,

Only using ReLu can't create such a beautiful classification of two kinds of coloured dots, or perform well in making predictions.
We already know, that how a neural network works basically, we feed the input layer with some input, and then the output of that input layer gets fed to a hidden layer and then finally it goes to the output layer.
Similarly, if we use ReLu as the activation for the input layer and in other layers, we also need an activation function in the output layer which can help us to smoothen our results based on our problem.
For that purpose, we have Sigmoid and Softmax activation functions.
These activation functions are generally used in the output layer of our network, and which one to use among them is based on the type of problem we are solving. If we are solving a multi-class classification problem then Softmax performs well compared to Sigmoid, and for the binary classification problem, Sigmoid is preferred.
Back to our problem with the dataset make_moons() from sklearn.datasets.
If I create a neural network with the above mouthful information,
from sklearn.datasets import make_circles
import tensorflow as tf

# set the random seed
tf.random.set_seed(17)

# Make 1000 samples
n_samples = 1000

# Create circles
X, y = make_circles(n_samples,
                    noise=0.03,
                    random_state=42)

# create a model
model = tf.keras.Sequential([
    tf.keras.layers.Dense(4, activation='relu'), # reLu activation function for hidden dense layers
    tf.keras.layers.Dense(4, activation='relu'), # reLu activation function for hidden dense layers
    tf.keras.layers.Dense(1, activation='sigmoid', name='output_layer') # This is a binary classification, so I used sigmoid
])

# compile a model
model.compile(loss='binary_crossentropy',
                optimizer='Adam',
                metrics=['accuracy'])

# fit the model
history = model.fit(X, y, epochs=200, verbose=0)
and then Plot the decision boundary of this model,
See, how well our network can differentiate the non-linear data.
Final Thoughts
and That's a wrap for this topic. There are many resources out there which demonstrated individual topics in-depth, I've tried to show what impact it creates while designing our neural network in the presence of these concepts and the absence as well.
Hope you liked it.
Drop some feedback or suggestion in the comment section below if you want.
Thanks for your time. Keep Building 🦾


